SPG
D-01active

Work Order Quality

Trash in, trash out is not normal.

Fewer than 2% of work orders come through planned and actionable out of the gate. If it isn't correct, it's wrong.

programmatic WO grading at scaledocumentation scoringintake validation gatesturning EAM/CMMS mess into time and material savings
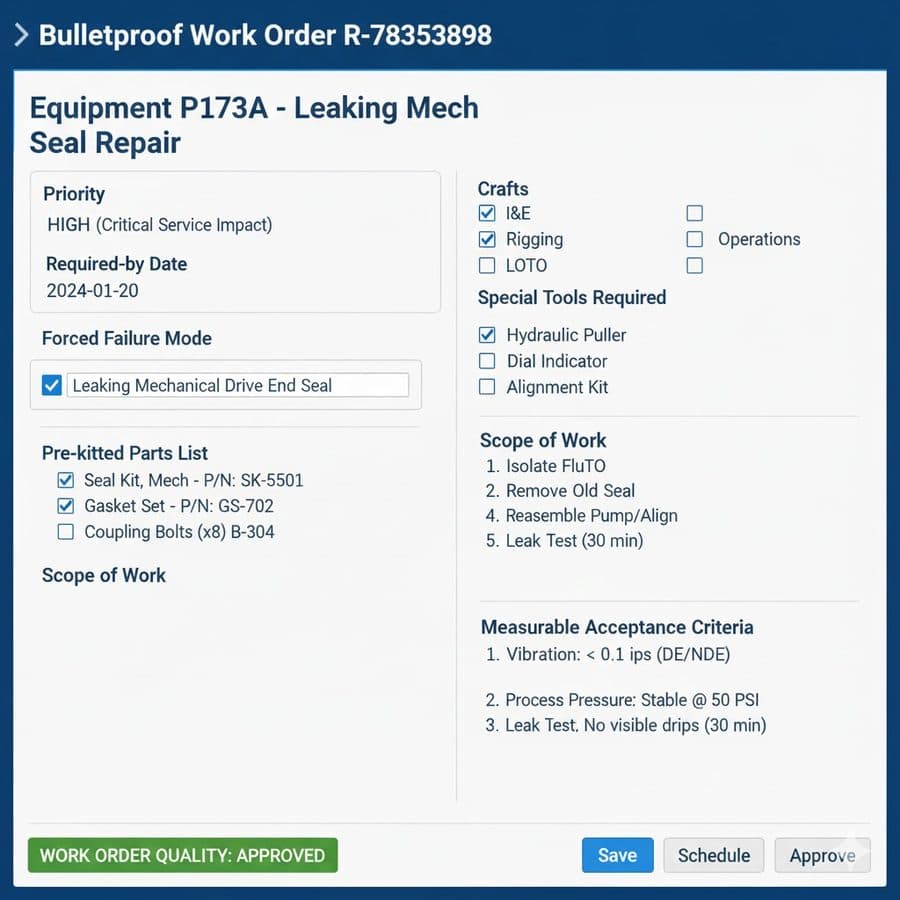
A work order with failure mode, kitted parts, scope and acceptance criteria filled inthe after
The offer
WO-Quality Sprint
$20K · 2 wk

Your work-order quality scoring engine, built from your own CMMS export.

Start with the $4,500 Teardown →
Proof

What shipped

Grading work-order quality at scale

Turn 'these work orders are bad' from opinion into a defensible score - programmatically.

Situation
A major industrial gas producer's maintenance teams wrote corrective work orders with no consistent quality standard; leadership suspected poor documentation but couldn't measure it.
Built
A 0-60 scoring engine that grades every corrective WO's documentation quality against a fixed rubric, run monthly off the CMMS export.
Outcome
Scored 525 operating corrective WOs across 7 sites on the 0-60 approval rubric, triaged into four tiers (plannable / minor rework / major rework / rewrite). The point isn't the score, it's the output: a graded, triaged queue that saves planners time and the plant material.
525 operating CMs scored7 sites0-60 approval rubric4-tier triage

Catching bad work orders at the keyboard

Move quality control upstream - validate a WO before it enters the system.

Situation
Grading WOs after the fact is forensic; the real leverage is stopping bad ones at creation.
Built
A tool that scores a WO 0-100 in real time as it's written and won't pass junk through, then hands off to the normal CMMS workflow.
Outcome
A preventive quality gate that shifts a maintenance org from 'grade the mess' to 'prevent the mess.'
0-100 live scoringkeyboard-level validation

18,000 work orders assessed, fleet-wide

Grade the mess at machine scale - not by hand, by code.

Situation
A large industrial partner had never quantified how many of its turnaround work orders were actually ready to execute.
Built
A fleet-wide programmatic assessment of 18,000 turnaround work orders against a two-stage rubric: 60 points at the approval gate, extending to 100 points at the 'planned' stage - the extra 40 points being the planning-critical detail front-end operators must supply for the back-end maintenance team to execute the repair.
Outcome
The 18,000 WOs averaged 15.2/60 at the approval gate and just 17.2/100 once the full planning rubric applied - the planning detail the maintenance team needs is almost entirely missing. Fewer than 2% came through planned and actionable out of the gate; if it isn't correct, it's wrong. Since training, scores are climbing - slowly: years of zero-documentation habits don't reverse overnight, especially with several initiatives landing at once - but the trend line now exists and moves. Backed by 20+ years reading that same mess by hand.
18,000 turnaround WOs assessed15.2/60 at approval gate17.2/100 at planned stage<2% planned & actionable out of the gate20+ years field grounding

← all departments